» Home > Troubleshooting >
"Dye Blobs"

Identification
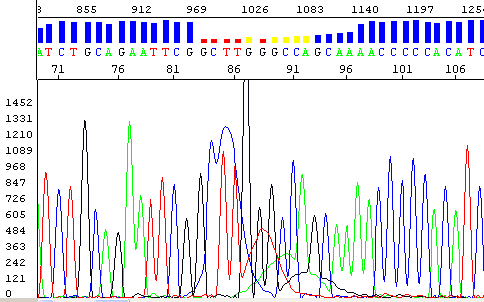
- Peaks of excess dye present in the raw data trace
- Dye blobs in the electropherogram usually around positions 80, 120 and 190
- Low signal to noise ratios (S/N G:<50 A:<50 T:<50 C:<50)
Causes
- Incorrect estimation of template concentration (insufficient used)
- Poor removal of unincorporated dye terminators post-sequencing reaction
^ Top Of Page
Overcoming Problem
- Check template concentration by a combination of agarose gel and spectrophotometer readings
- Use fresh ethanol and sodium acetate (at room temp.) and use correct concentrations if using ethanol precipitation as clean-up method
- With microfuge tubes, aspirate the supernatant rather than decanting during clean-up
- Do not use denatured alcohol during clean-up
- Do not leave reactions precipitating overnight as they can "over-dry" and are more difficult to resuspend


